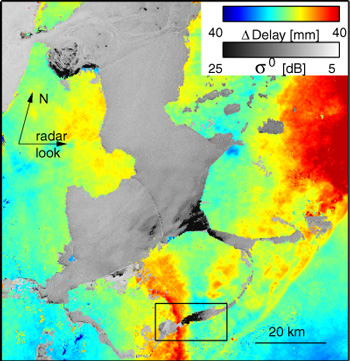
next up previous
Up: Tropospheric wind and humidity Previous: Bibliography

List of Figures


Figure 1: Differential SAR interferogram of a cold front, indicated by the diagonal line in the lower right corner. The area left of this line is the cold air mass ($14^\circ $C), the area right is the warm air mass ($17^\circ $C). Precipitation occurs only over the red areas in the interferogram. The curved feature in the lower part of the interferogram is a region with strong precipitation.
Differential SAR interferogram of a cold front


Figure 2: (a). Phase-intensity observations over Veluwe Lake, the Netherlands. The colored section shows interferometric phase observations, converted to slant signal delay variations in mm. The gray-scale part of the figure is derived from the backscatter intensity during the ERS-2 acquisition, and is scaled to logarithmic $\sigma ^0$ values. The band with increased delay indicates strong rain, and is clearly correlated to the increased surface roughness over the water. (
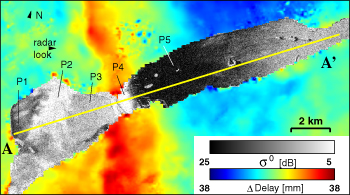
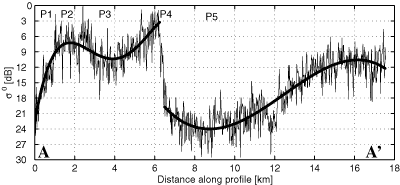
b) Cross section AA' of the radar cross section values in panel (a) The $\sigma ^0$ values increase approximately 18 dB due to wind patterns associated with the storm. Behind the first rain band, indicated by label P4, roughness decreases and increases again, as observed in the first 6 km of the cross section. (
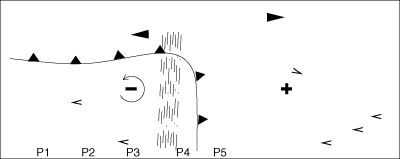
c) Sketch of the circulation patterns associated with the cold front, after  Parsons [1992]. The vertical shear in front of the storm consists of a windless area at the surface and probably a southwesterly wind aloft.


Figure 3: Radar intensity observations over IJssel Lake on 4 April 1996, 10:35 UTC, combined with signal delay differences derived from the interferometric phase between 4 and 5 April 1996. The signal in the interferometric phase is mainly due to water vapor differences between the moist updraft and the dryer downdraft regions [Weckwerth et al.(1996)]. The signal in the intensity observations over water is due to variations in the wind speed, and to a lesser extend wind direction, associated with the rolls.


next up previous
Up: Tropospheric wind and humidity Previous: Bibliography

© 2000 by American Geophysical Union