

Next: Implementation
Up: M_FILTAZI
Previous: Input Cards
Contents
In the process control array, the switch for azimuth filtering is turned on:
filt_azi: 1
In the master result file a section is added with the new file name:
 *******************************************************************
 *_Start_filt_azi:
 *******************************************************************
 Input_file:                             Outdata/1393.raw
 Data_output_file:                       Outdata/1393.azifilt
 Data_output_format:                     complex_real4
 First_line (w.r.t. original_master):    1
 Last_line (w.r.t. original_master):     3500
 First_pixel (w.r.t. original_master):   1
 Last_pixel (w.r.t. original_master):    500
 *******************************************************************
 * End_filt_azi:_NORMAL
 *******************************************************************
A file (mph) is created for the master, with filtered spectrum.
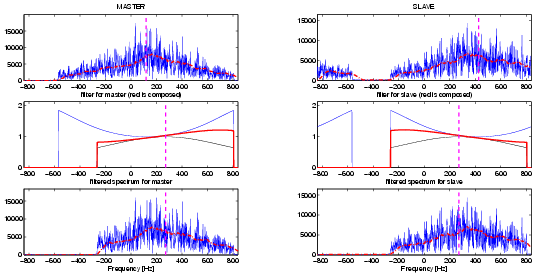
Figure 15.1 demonstrates the filter for 2 images:
Figure 15.1:
Azimuth filtering for a master (left) and slave (right) SLC image
(frame 2781, orbit 1393 (master, ERS2, 27-JUL-1995) and orbit 21066
(slave, ERS1, 26-JUL-1995)). The Doppler centroid frequency for the
master is f
 Hz (constant for all columns), for the slave
f
 Hz, (obtained from the result file (read from SLC
leader)). The mean Doppler centroid equals f
 Hz.
(Doppler centroid are indicated by dashed magenta lines, x axis are
frequencies from [-PRF/2:PRF/2].) The azimuth spectrum was weighted
with a Hamming window (
 ). (Pictures on first row,
original spectra for range column 101, red dashed line is a 51 point
moving average).
The filtering (middle row) first de-weights by 'inverse' Hamming,
centered at the image Doppler centroid,
and bandlimited to the total azimuth bandwidth (
 Hz).
Next a new Hamming filter is applied,
centered at the mean Doppler centroid,
and bandlimited to
 Hz.
Obviously, the filter for the slave is the inverse of that of the master.
The resulting spectra are shown in the bottom row.
The frequencies that did not overlap are filtered out,
yielding a better coherence between master and slave image.
The spectrum and filters depicted here are FFT shifted for clarity.
 |


Next: Implementation
Up: M_FILTAZI
Previous: Input Cards
Contents
Leijen
2009-04-14

