 |
The process control flags in the result files for the master and the slave are switched on:
filt_range: 1
In the filtrange section the filename and format is described after the filtering. Master and slave are cut out so they exactly fit on each other.
 *******************************************************************
 *_Start_filt_range:
 *******************************************************************
 Method:                                 adaptive
 Data_output_file:                       Outdata/23070.rfilter.3
 Data_output_format:                     complex_real4
 First_line (w.r.t. original_master):    201
 Last_line (w.r.t. original_master):     6000
 First_pixel (w.r.t. original_master):   100
 Last_pixel (w.r.t. original_master):    3000
 *******************************************************************
 * End_filt_range:_NORMAL
 *******************************************************************
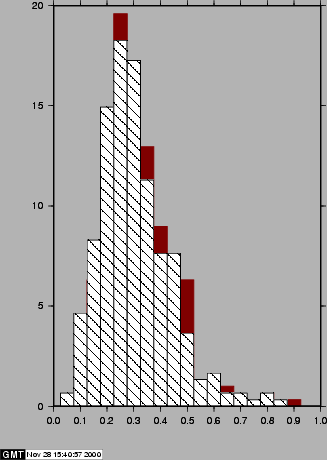
Figure 22.1 shows the improvement in the correlation for method porbits. A histogram is made of the correlation values of the FINE coregistration with and without range filtering. The area was relatively flat and the perpendicular baseline was approximately 175 meters.
 |